freq-nav-sim2real
Frequency-Based Visual Invariance for Sim-to-Real Embodied Navigation
Simulated and real images differ unevenly across the spectrum: style sits in the low frequencies, geometry in the high ones. A policy leaning on the band that shifts most across domains fails on transfer, so this project locates that band by removing frequencies and watching where navigation breaks.
Approach
Fourier Domain Adaptation swaps low frequency amplitude between domains while preserving phase, so structure survives and style transfers. A perturbation module keeps a disc of radius r around the DC term and injects noise outside it, turning surviving high frequency content into a training parameter.
Architecture
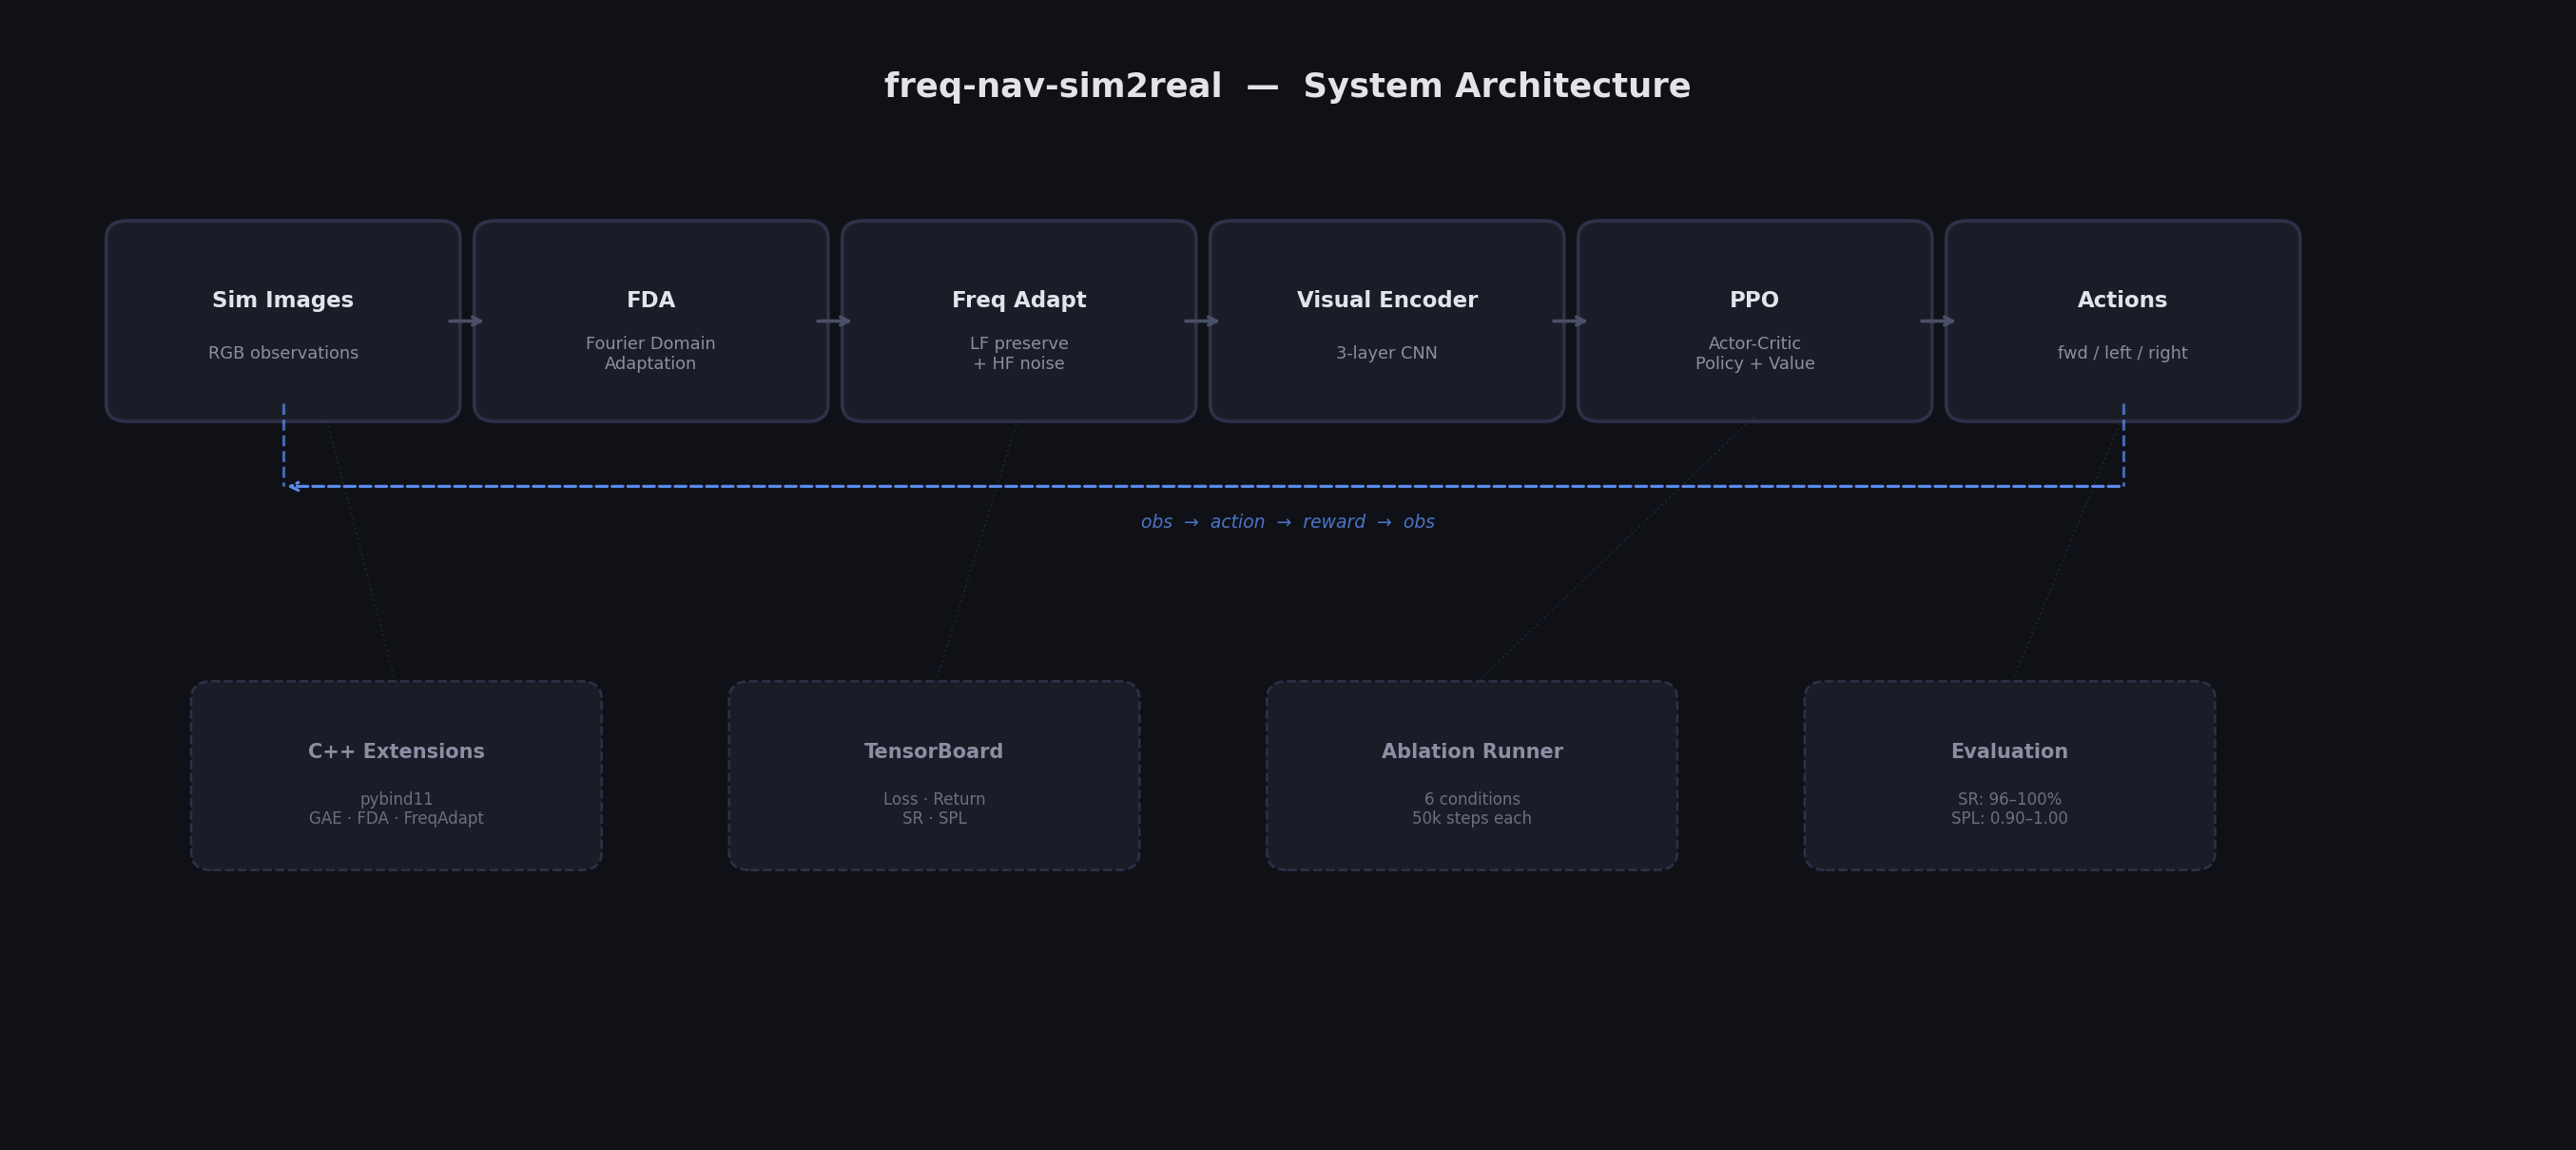
Observations pass through both operators, then a three layer CNN encoder and a PPO actor critic. GAE, the Fourier swap, the perturbation, and the environment step loop run as C++ extensions through pybind11.
Observations
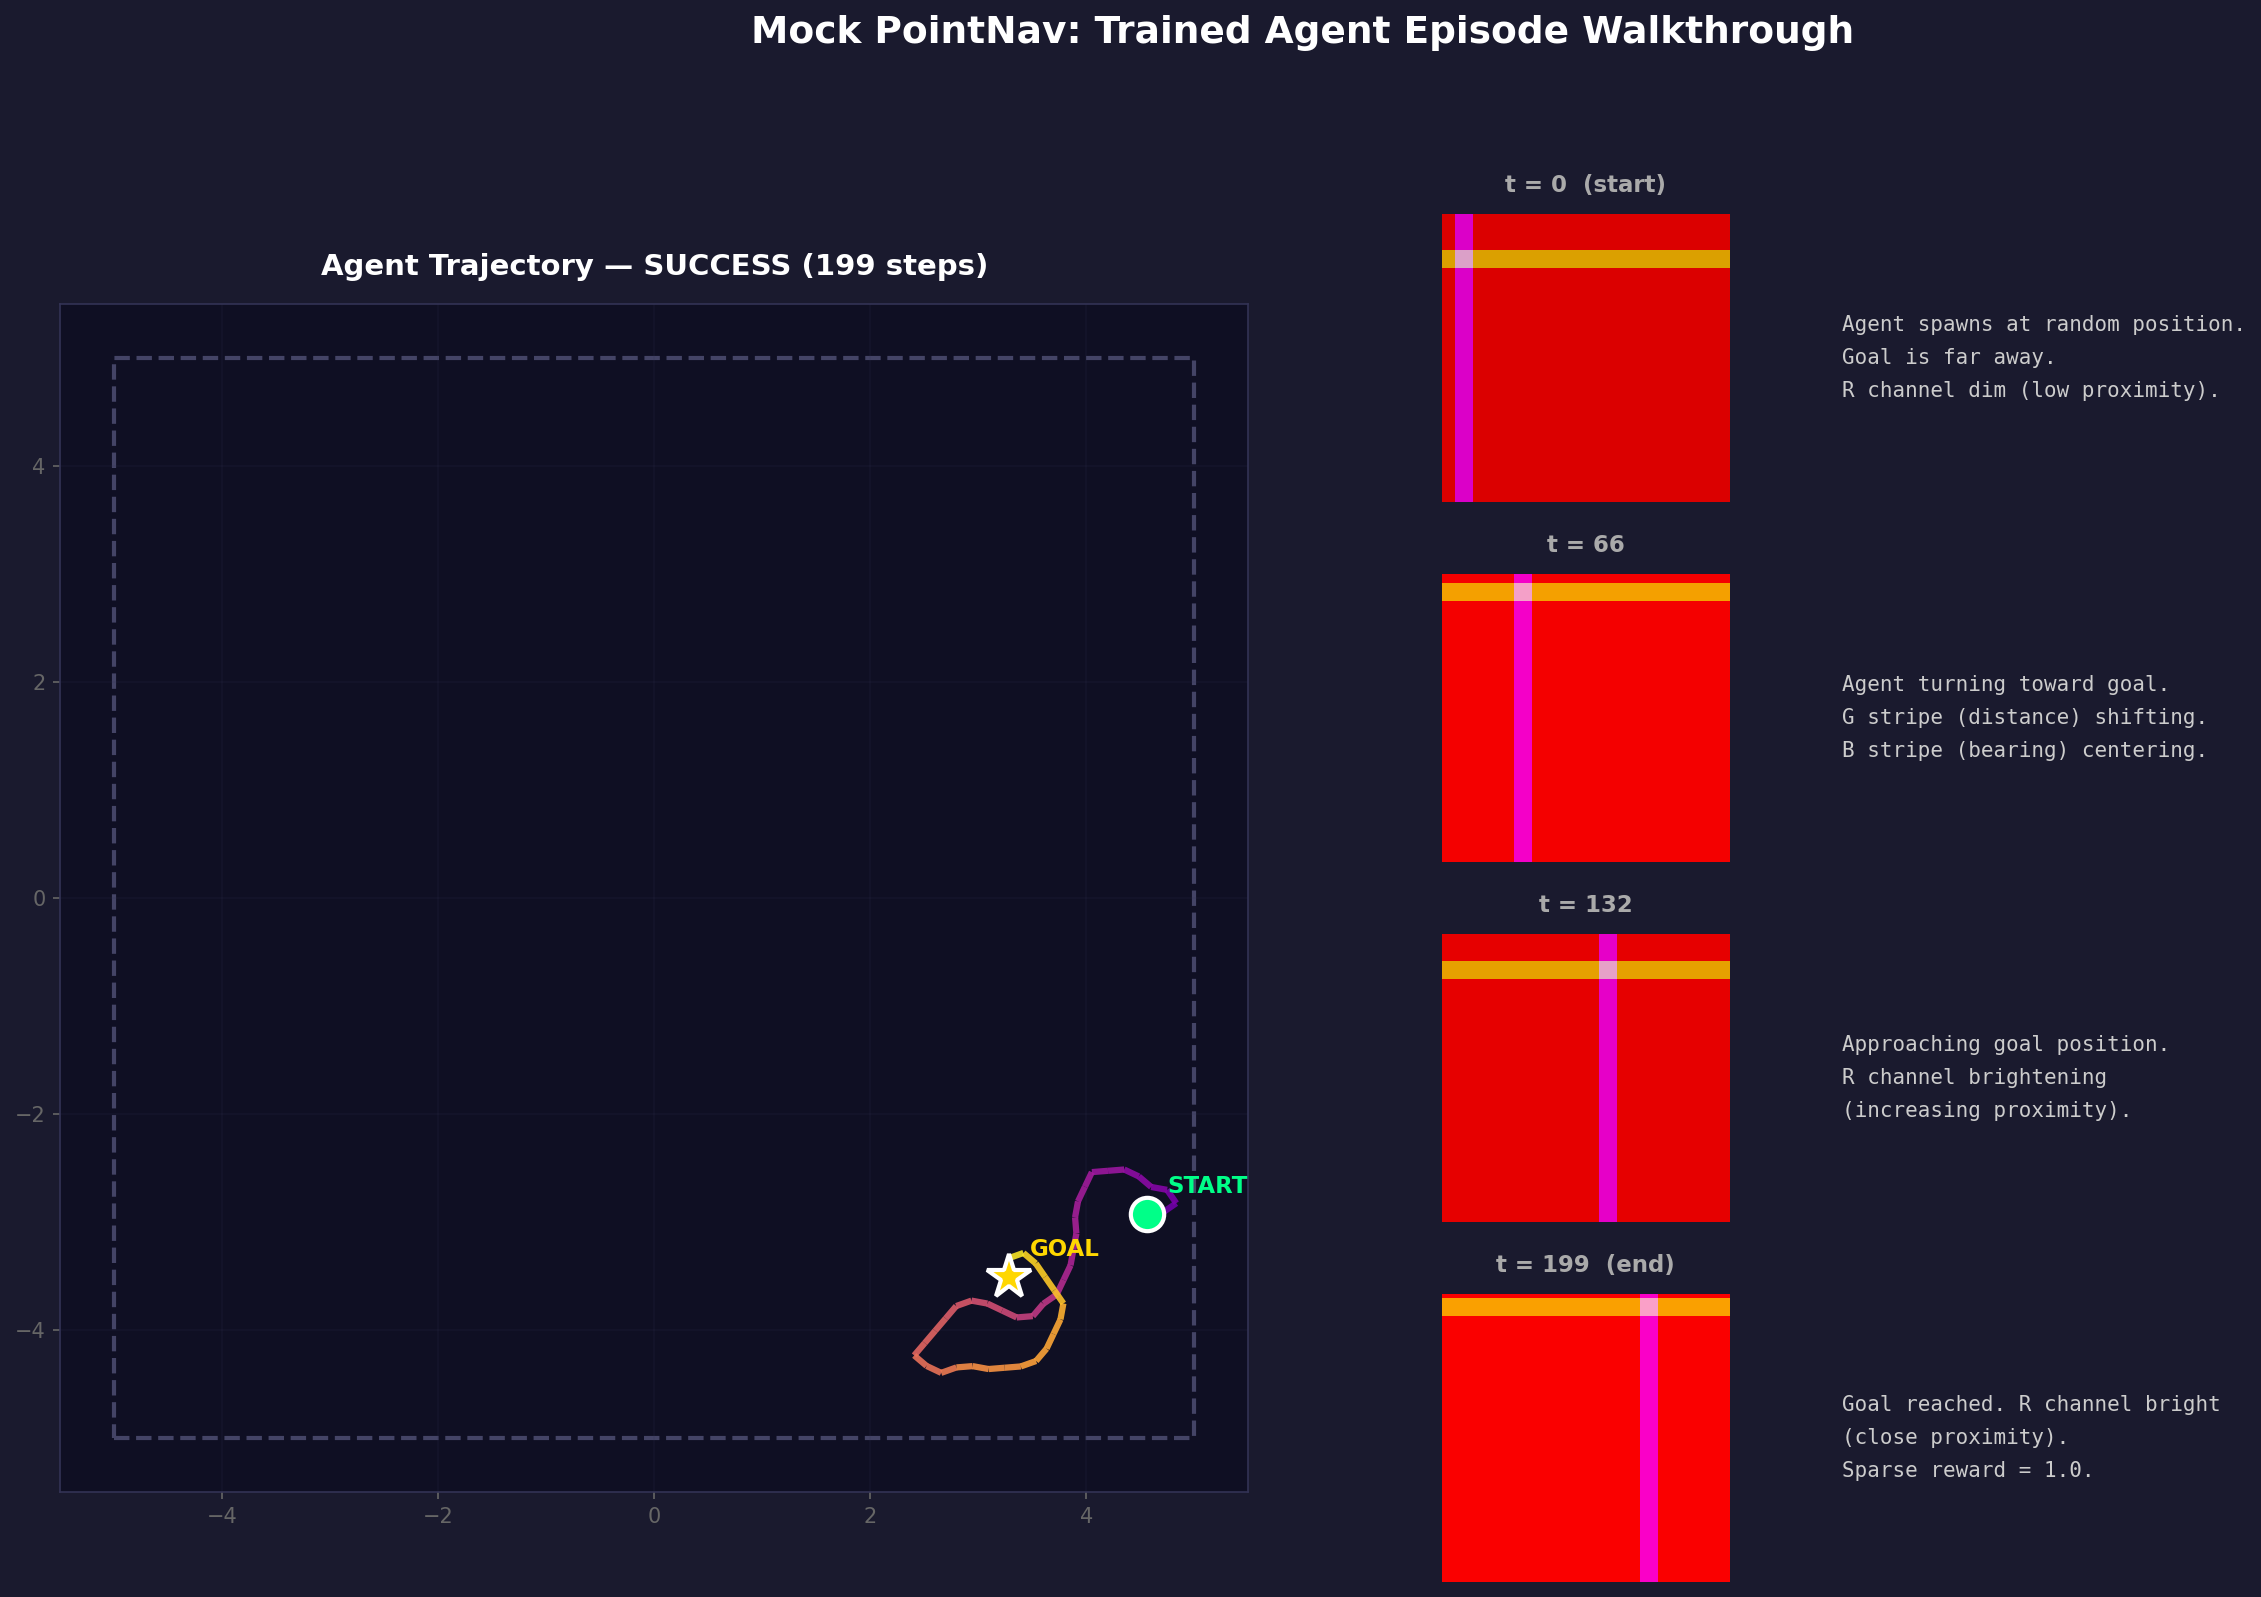
Observations are encoded rather than photographic. The red channel carries goal proximity, and green and blue stripes carry distance and bearing.
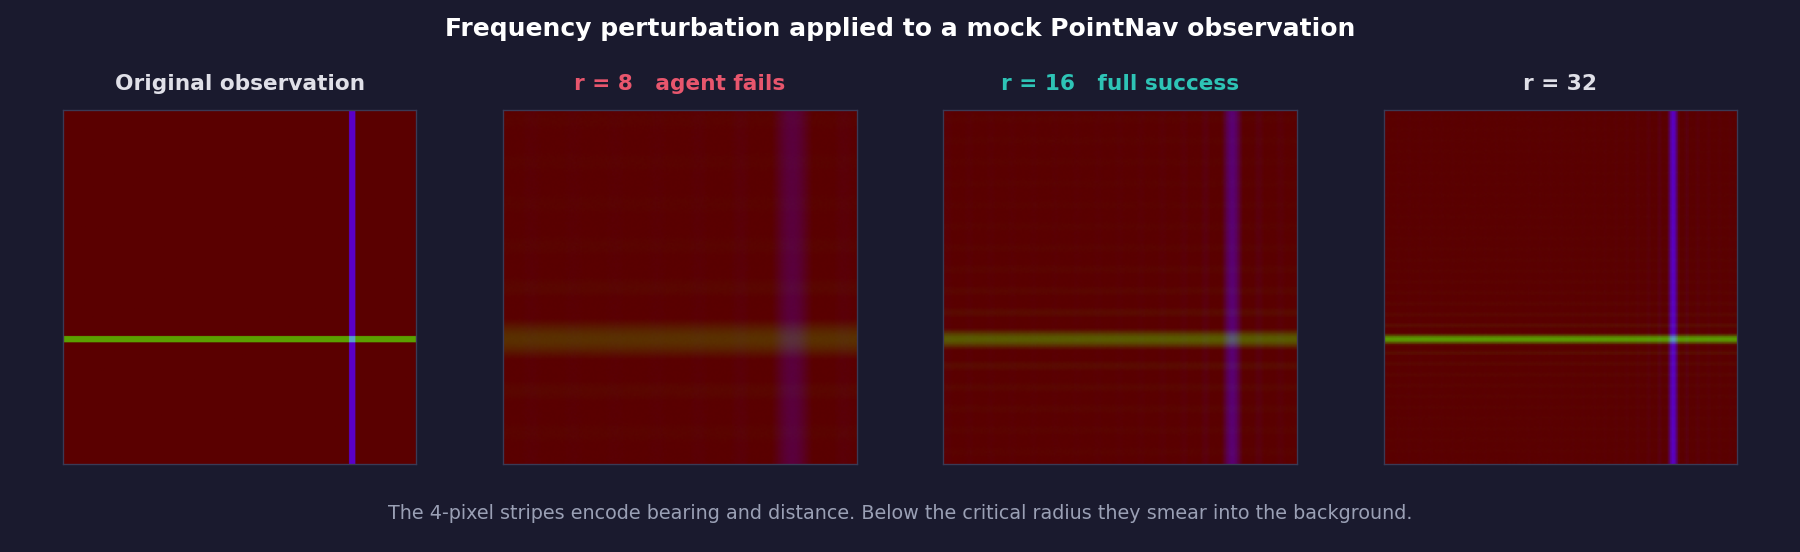
Those stripes are four pixels wide on a 224 pixel frame, which puts the whole goal signal high in the spectrum. Running the perturbation on a real observation shows what each cutoff costs.
Stack
| Area | Tools |
|---|---|
| Learning | PyTorch, PPO actor critic, Habitat-Sim, Habitat-Lab |
| Performance | C++, pybind11 |
| Data and tooling | NumPy, OpenCV, TensorBoard, matplotlib, pytest |
Results
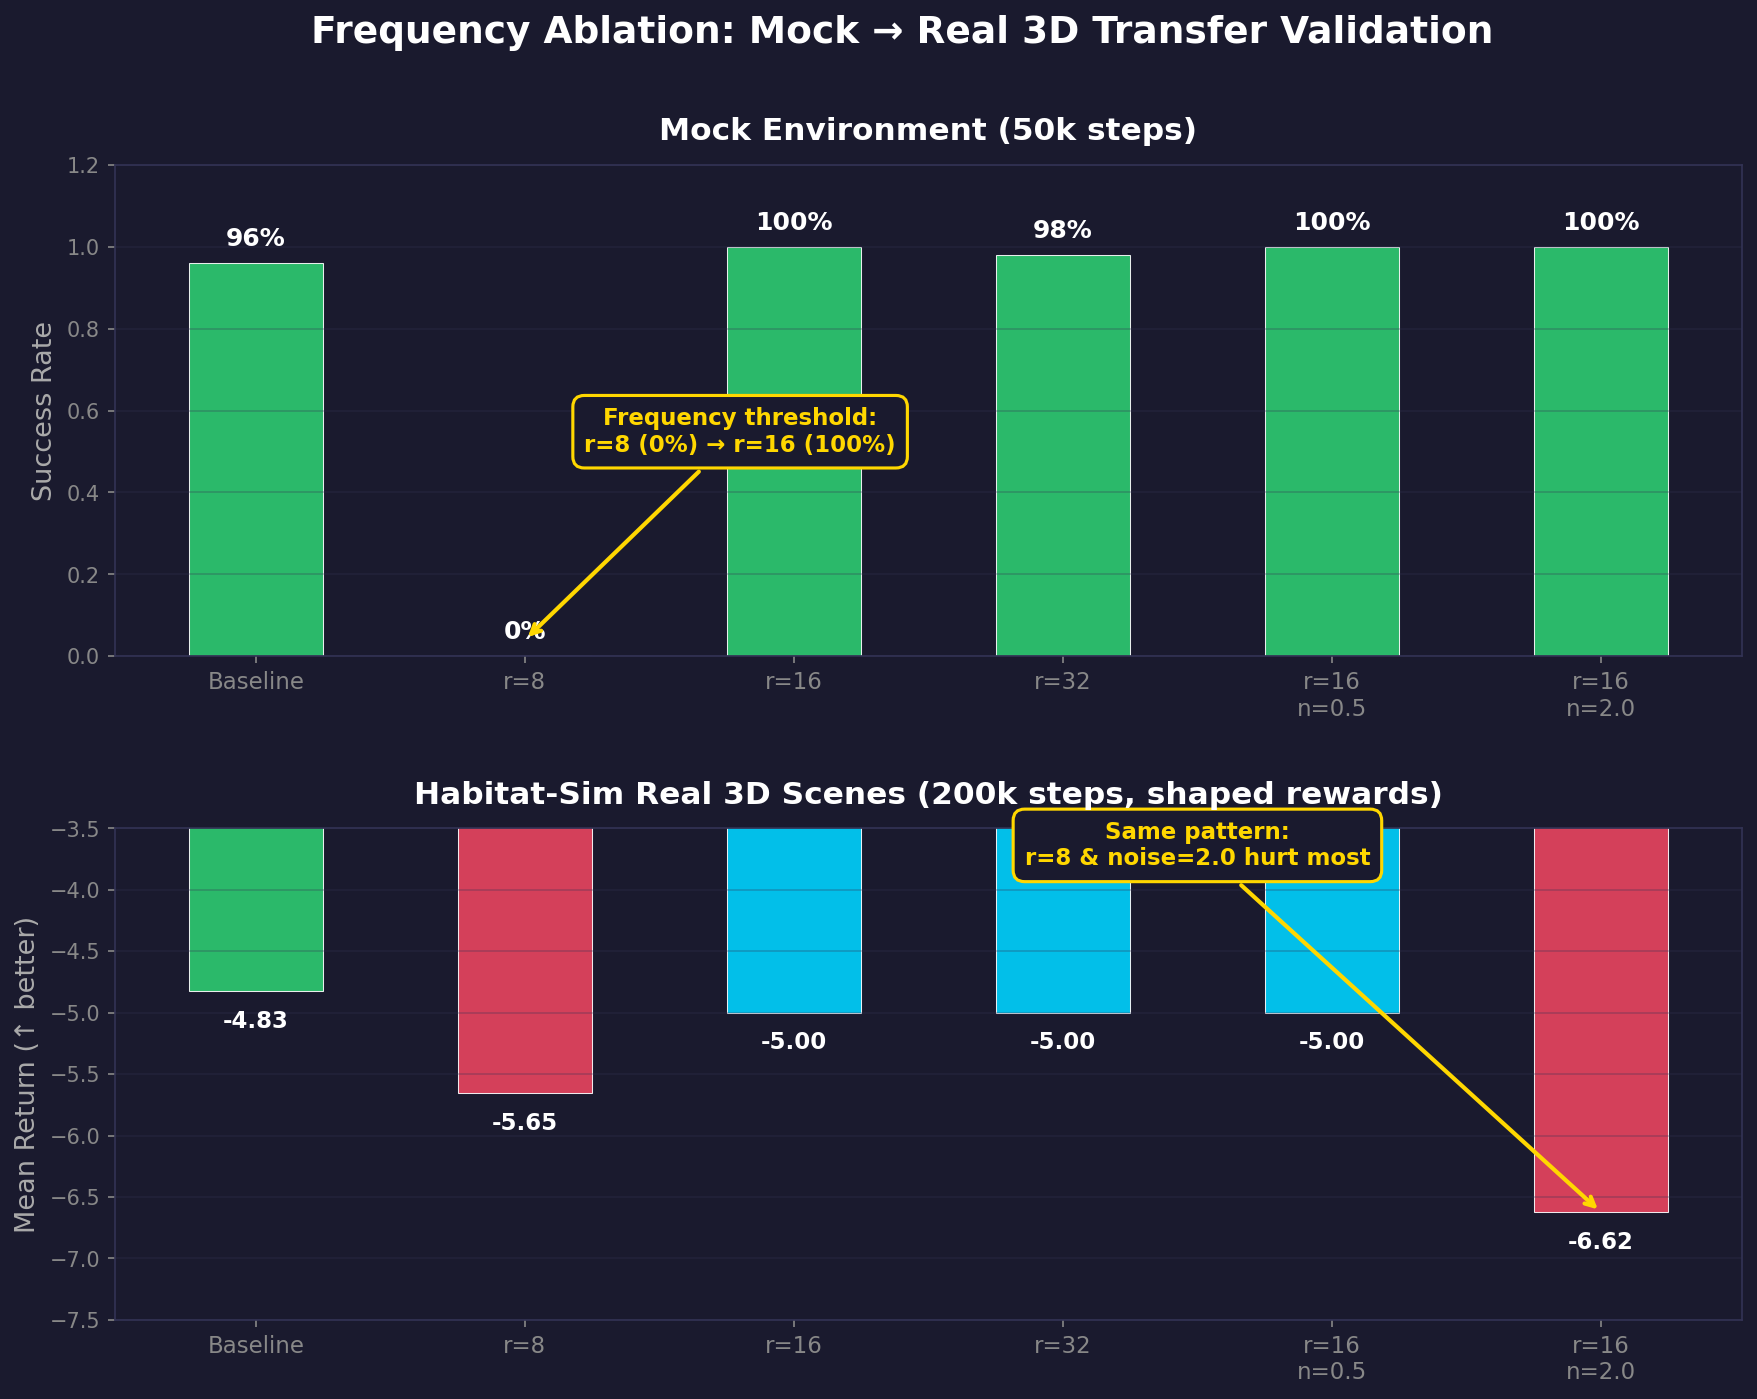
Six conditions in the mock environment, each trained 50k steps and evaluated over 50 episodes at a fixed seed. SR is success rate; SPL weights success by how efficient the path was.
| Condition | Radius | Noise Std | SR | SPL |
|---|---|---|---|---|
| baseline | — | — | 0.96 | 0.907 |
| freq_r8 | 8 | 1.0 | 0.00 | 0.000 |
| freq_r16 | 16 | 1.0 | 1.00 | 0.929 |
| freq_r32 | 32 | 1.0 | 0.98 | 0.904 |
| freq_r16_noise05 | 16 | 0.5 | 1.00 | 1.000 |
| freq_r16_noise20 | 16 | 2.0 | 1.00 | 0.998 |
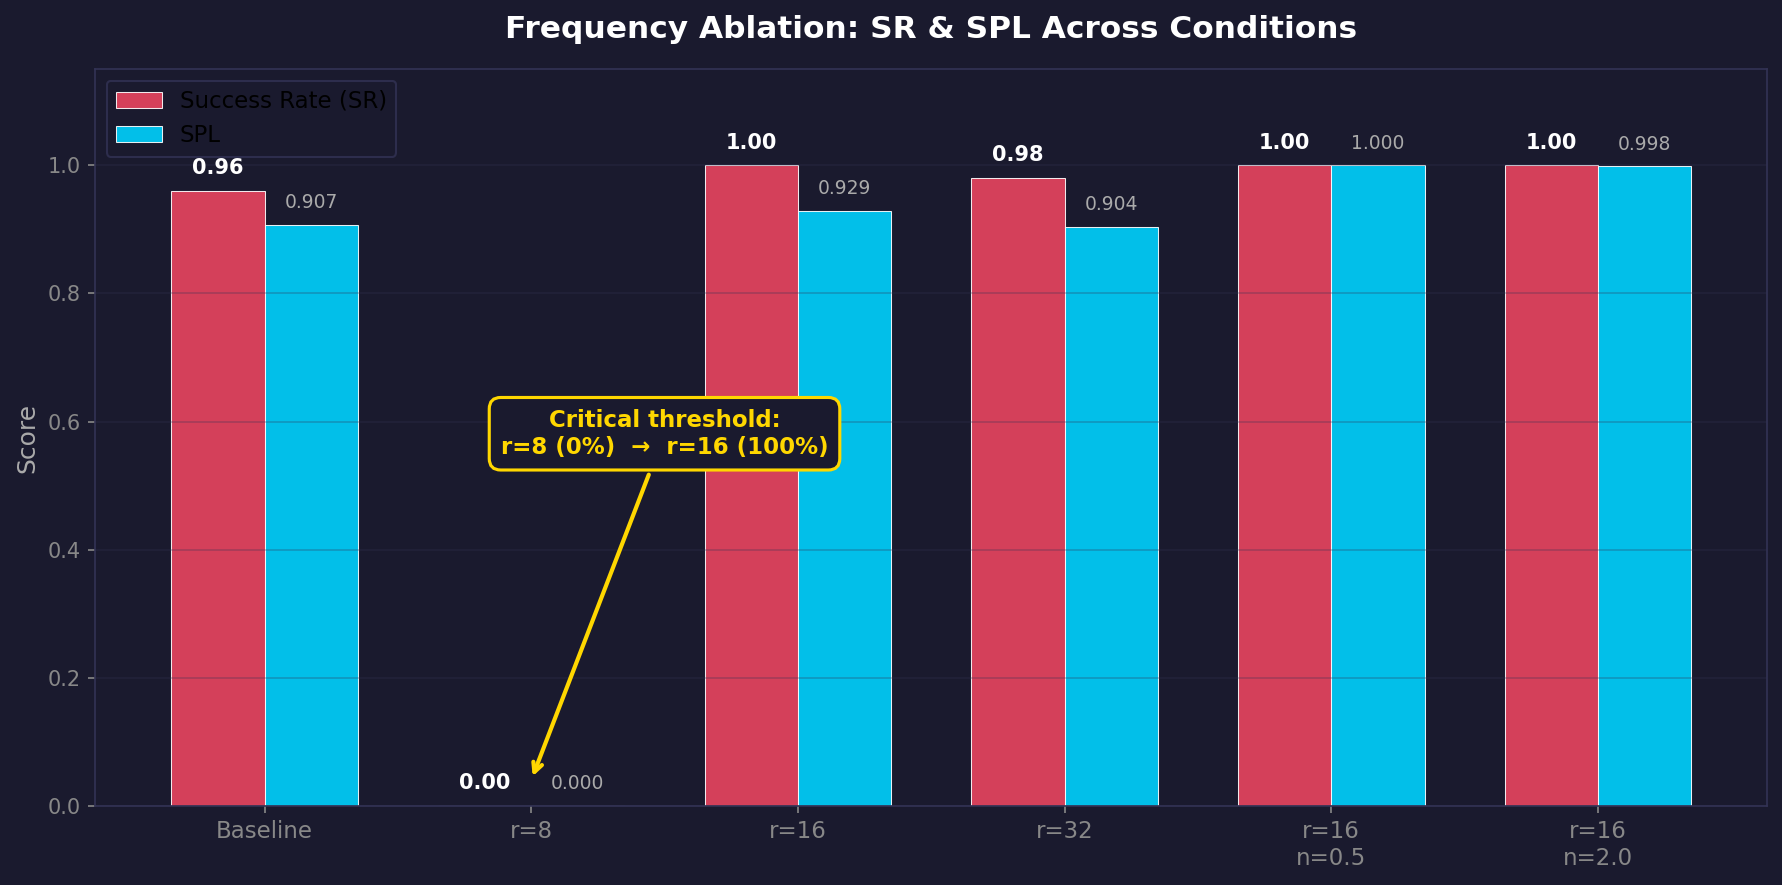
At radius 8 the agent fails every episode, running to the step cap rather than degrading. At 16 and 32 it matches or beats the baseline, so noise in place of high frequency magnitude regularizes rather than damages. Intensity barely matters: at radius 16, weak and strong noise both reach full success.
Threshold
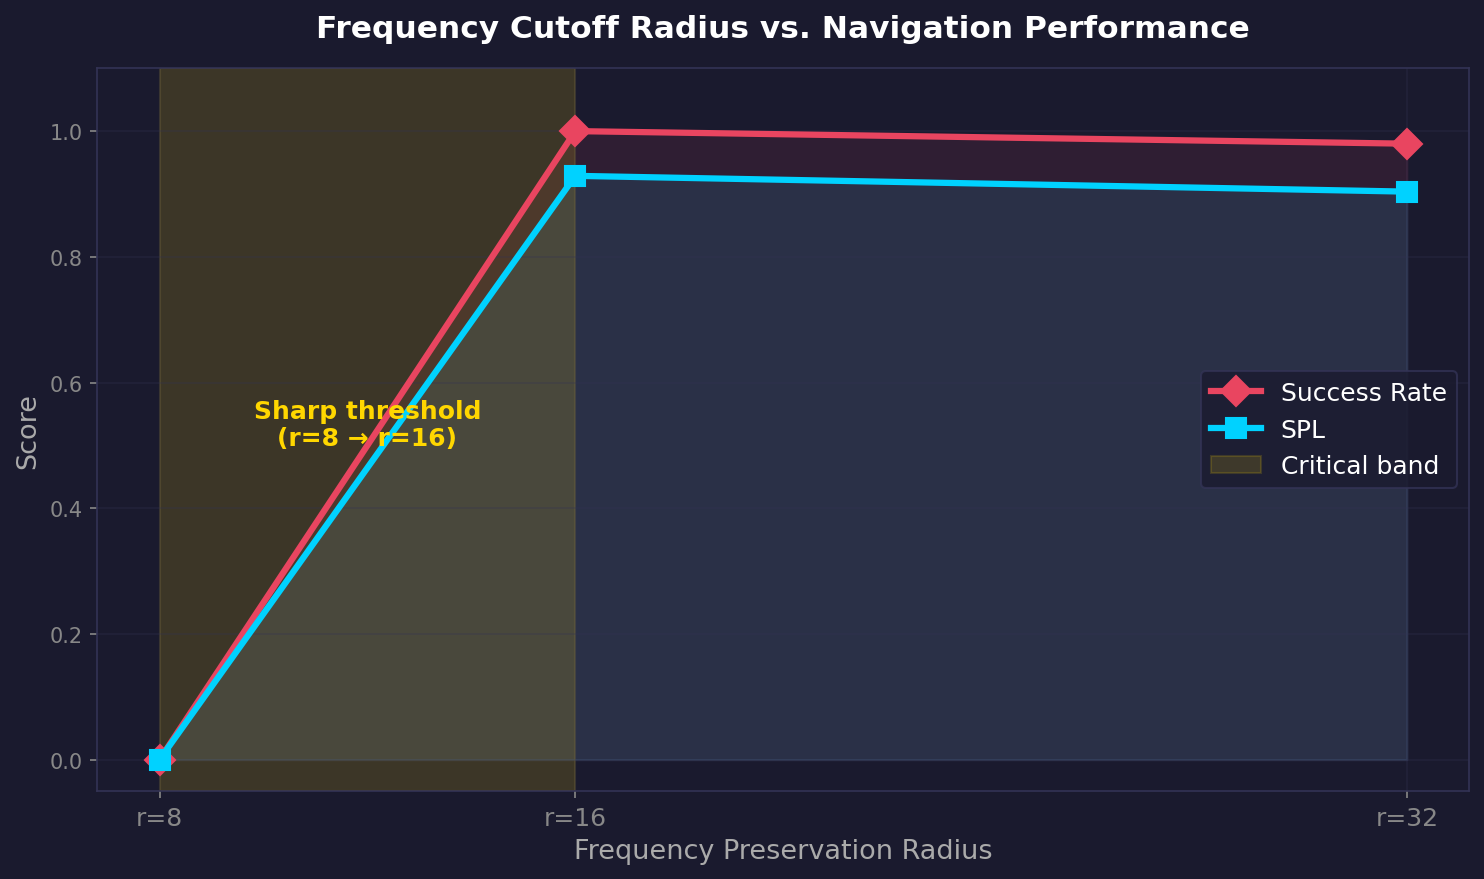
The transition is discontinuous. Between radius 8 and 16 the agent goes from total failure to perfect success, placing the critical band in that range.
Habitat Validation
The same six conditions then ran in Habitat-Sim on reconstructed real scenes, at 200k steps with shaped rewards.
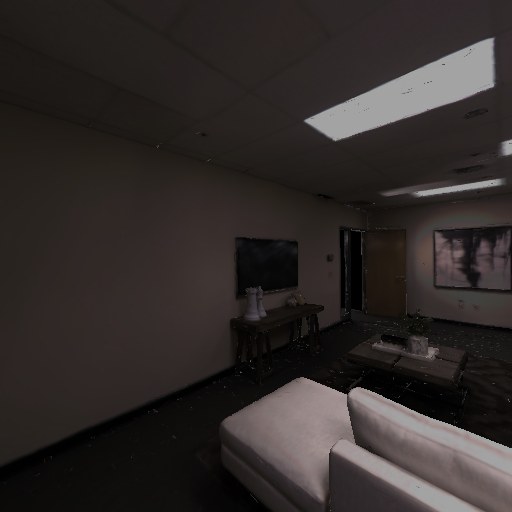
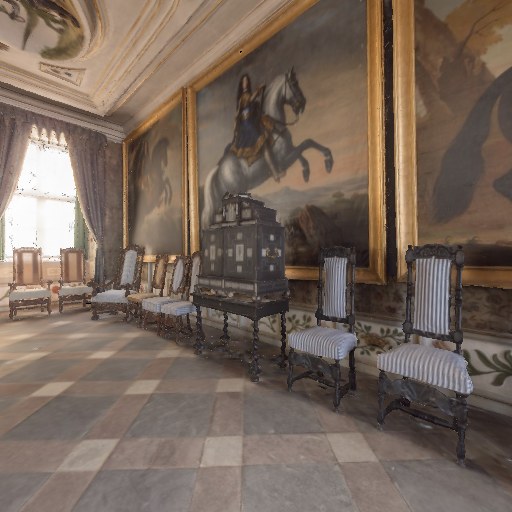
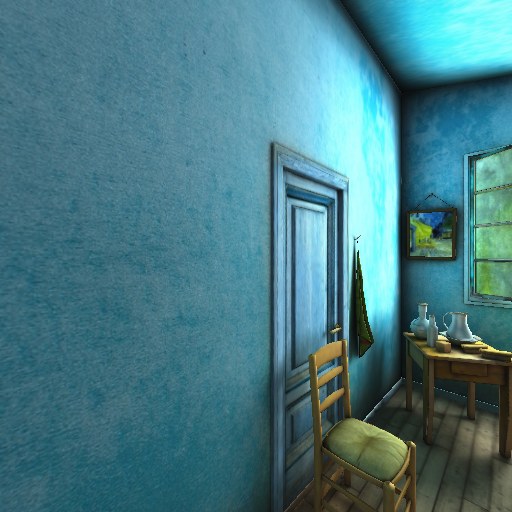
Photorealistic geometry and lighting replace the encoded stripes, so the frequency content the policy reads is now ordinary scene structure rather than a synthetic signal.
| Condition | Radius | Noise Std | Mean Return |
|---|---|---|---|
| baseline | — | — | −4.83 |
| freq_r8 | 8 | 1.0 | −5.65 |
| freq_r16 | 16 | 1.0 | −5.00 |
| freq_r32 | 32 | 1.0 | −5.00 |
| freq_r16_noise05 | 16 | 0.5 | −5.00 |
| freq_r16_noise20 | 16 | 2.0 | −6.62 |
No condition reaches a goal here. Every episode runs to the 500 step cap, so success rate and SPL are zero throughout and shaped return is the only signal separating conditions: a small CNN at 200k steps does not solve real PointNav.
Within that signal the mock ordering reappears. Radius 8 falls below baseline, the strongest noise setting is worst of all, and r=16, r=32 and the low noise variant sit together at −5.00. The frequency sensitivity survives the change of environment even though absolute performance does not.
The repository carries a 91 test suite covering the Fourier swap, the perturbation, GAE and the PPO update, both environments, the models, metrics, and plotting.
If you’re interested in the code, check out freq-nav-sim2real on GitHub! 🚀